hypothesis-test-for-a-population-mean-lab
Prompt
The drinks datafile is available in the Data section below.
- Let
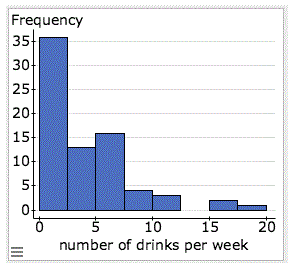
be the mean number of alcoholic beverages that students in the liberal arts college drink in a typical week. State the hypotheses. - Here is a histogram of the data. Can we safely use the t-test with this data? Explain.

- Perform the t-test using StatCrunch. (directions)
Copy and paste the information from the StatCrunch output window into your initial post. - Hypothesis test results:
Variable Sample Mean Std. Err. DF T-Stat P-value number of drinks per week 3.9333333 0.43592434 74 -1.8275343 0.0717 - Based on the P-value, state your conclusions in context. Use a 5% level of significance.
NOTE: You do not need to double the P-value for this two-tailed test. StatCrunch calculates the P-value for you. - Using the context of this scenario, explain the meaning of each of following items from the StatCrunch output for the hypothesis test.
- Std. Err (standard error)
- T-stat (T-score)
- P-value


